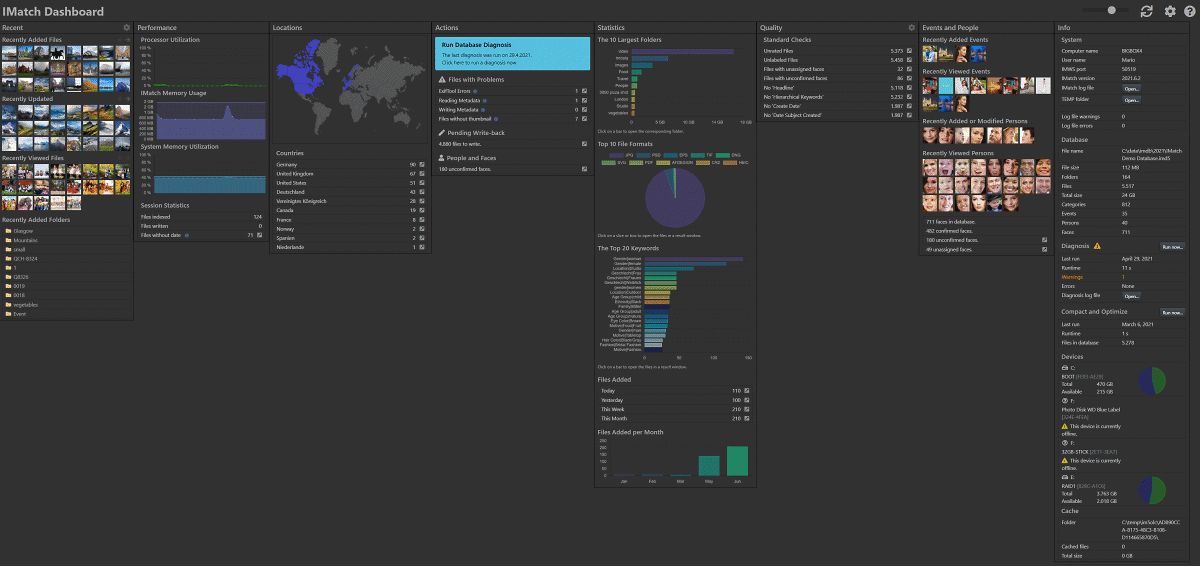
The complete dashboard (we've zoomed out quite a bit and used a large monitor).
The Dashboard is the single place to see everything that's important about your file collection and IMatch database.
All that's important in one place—the Dashboard.
The Dashboard is the single place to see everything that's important about your file collection and IMatch database:
To use the Dashboard, switch to the Dashboard View by either clicking on the corresponding tab at the top of the IMatch window or use the View > Views > Dashboard command.
The complete dashboard (we've zoomed out quite a bit and used a large monitor).
When activated, the Dashboard updates all panels to show up-to-date information. Depending on the size of your database and the speed of your computer, this can take a few seconds. While a panel is updating, it displays a small animated icon in its header.
While the Dashboard is active, it monitors IMatch and updates panels automatically to refresh the displayed information when needed. You can trigger an update manually by clicking the icon in the Dashboard toolbar.
When you switch to another View, the Dashboard deactivates itself to minimize processor and memory usage. When you switch back later, it automatically refreshes all panels to show up-to-date information.
The Dashboard is interactive. Many of the displayed items display additional information when you hover the mouse cursor over them. Many things are also clickable, performing a task or opening a Result Window with files when clicked. See the following sections for details.
Depending on the size of your monitor, the screen resolution and the panels you activate in your Dashboard, scrolling will be necessary to see all information. Use these commands and actions to quickly reach and see all sections of your Dashboard:
Mouse wheel | Scroll up and down. |
Shift + Mouse wheel | Scroll left and right. |
Ctrl + Mouse wheel | Zoom in and out. Alternatively, use the zoom slider in the toolbar to zoom in and out. |
Ctrl + 0 | Reset zoom to 100%. |
The Dashboard is divided into multiple vertical panels. Each panel displays a different group of related information. You can configure the visible panels and the order in which they appear in the Dashboard configuration.
By default, the Dashboard hides technical data that is only interesting or relevant to expert users.
Enable the Expert Mode in the Dashboard configuration to see all available data, information and statistics.
This panel displays recently added, updated and viewed files in separate sections. Each file is represented with a thumbnail.
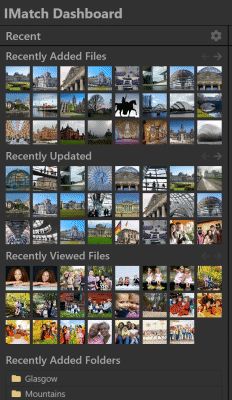
The Recent Panel
Hover the mouse cursor over a thumbnail to see the file name. Click on the thumbnail to jump to the file in the Media & Folders View.
The file lists display up to 10 pages of files. You can page forward and backward using the arrow keys above each list:
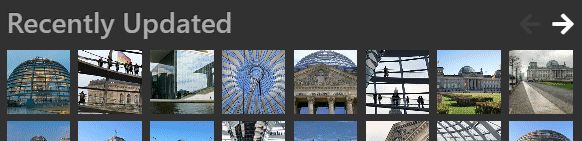
Viewing more recent files by paging.
This list shows folders recently added to the database. Click the folder name to switch to the Media & Folders View and open the folder.
Click the icon in the header of the panel to open the configuration dialog box for this panel. Here you can select the number of rows and columns to display for the recent files and how many recent folders you want to see.
This panel displays performance data, e.g., how much CPU resources and memory IMatch is currently using and the system memory utilization.
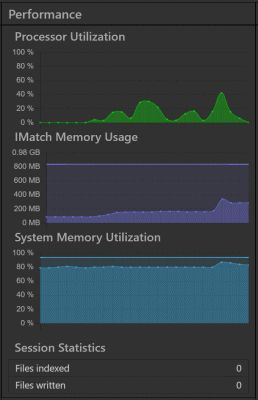
The Performance Panel.
These statistics are updated frequently to give you a reliable indication about the overall performance of your computer. This can be very helpful if you experience less than stellar performance in IMatch.
Here IMatch lists how many files were indexed and written in the current session.
Click on the arrow next to each value to view the files in a result window.
This row lists all files indexed in the current session which had no usable (EXIF/XMP) timestamp. IMatch had to fall back to using a file system timestamp.
You may want to check these files to set a proper date and time value in the Metadata Panel. Click the arrow button after the value to see these files in a result window. See How IMatch uses Date and Time Information for more information.
If the Expert Mode is enabled in the Dashboard configuration, additional statistics are included in this panel. The statistics are aimed at experienced users and developers and include things like the amount of data read and written in the current session and IMatch WebServices™ statistics.
This panel lists all country names used in the XMP country metadata tag in your files, and the number of files with that value. Click the button to view the files in a Result Window.
The world map at the top uses different shades of blue to color-code countries based on how many files from that country are in your database. Hover the mouse cursor over a country name to highlight that country on the map.
This list is created from the actual country names in your files. If you see misspelled country names or even nonsense data, open the affected files in a Result Window and update the country name in the Metadata Panel. Just select all files, change the country name, and you are done in no time.
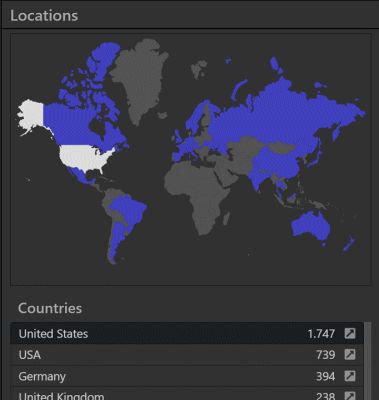
The Locations Panel.
IMatch maps countries to the corresponding world region using the TCL (two-letter country code) found in the metadata for the files.
IMatch fetches the XMP::iptcExt\LocationShownCountry\LocationShownCountry (Country) and XMP::iptcExt\LocationShownCountryCode\LocationShownCountryCode (Country Code) tags for each file to build the map. The country tag is used as the name in the list, and the country code is used to link a country with the corresponding world region in the map.
To deal with the not unusual case that metadata uses a three-letter country code ("SWE") instead of the two-letter code ("SE") for, e.g., "Sweden", IMatch uses a JSON file to map between three- and two-letter codes.
If an area on the map is grayed out, IMatch could not determine the two-letter country code for the country. Check if the LocationShownCountryCode tag has a value for all of your files.
This panel delivers important statistical data about your file collection.
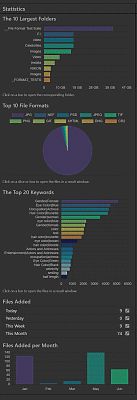
The Statistics Panel.
This section shows the 10 largest folders (based on disk space usage) in your database. Hover the mouse cursor over a bar in chart to see more details. Click a bar to open the corresponding folder in the Media & Folders View.
This pie chart groups the files in your database by file format and indicates their relative percentages. Hover the mouse over a slice in the chart for more information. Click a slice or box to open the files in that group in a Result Window.
This chart shows the 20 most-frequently used keywords in your database. Hover the mouse cursor over a bar to see more details. Click a bar to open the files with that keyword in a Result Window.
These statistics show you how many files you've added recently and over the past six months.
This panel shows interesting statistics about recently added or viewed events and recently added, modified or viewed persons. Hover the mouse cursor over a cover image for more information. Click the cover image of a person to open the person's files in the People View. Click a cover image of an event to open the event in the Events View.
If an event or person has no cover image, a placeholder is displayed instead. To set a cover image, follow these instructions.
At the bottom of the panel you see information about the total number of faces in the database, the number of confirmed/unconfirmed and unassigned faces. Click the button to open the containing files in a Result Window.
This is a very important panel. IMatch lists problems encountered and actions you should perform in this panel.
IMatch displays system messages in this panel to inform you about errors encountered or required actions to perform. Here are examples of an urgent and a not so urgent system message:

These system messages are fed by IMatch App Health, which is a feature that keeps track of certain events and situations.
When you fix an issue reported here, you need to restart IMatch to reset the system messages afterwards.
When Exiftool encounters an error while reading or writing a file, IMatch marks that file and includes it in the ExifTool Errors list in the Actions panel. To see the affected files, click on the button for this entry.
Files which caused problems when reading or writing also display a special warning icon in the File Window:
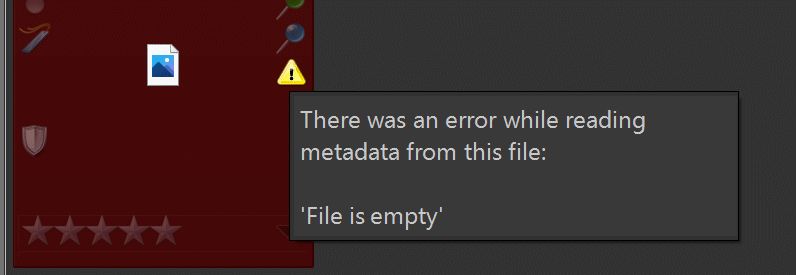
Hover the mouse cursor over this warning icon to get additional information. Depending on the error message issued by ExifTool, you may be able to fix the problem by loading the metadata again using Shift + Ctrl + F5 and selecting Reload Metadata in the dialog box.
See Icons Used in the File Window for more information.
When IMatch runs into problems reading or writing metadata from/to files, it marks these files and lists them in the Actions panel.
Errors while reading files can have many causes, from inaccessible files (file system permissions) to empty or corrupted files. Open the files listed here in a Result Window and review them. The warning icon displays more information when you hover the mouse cursor over it.
Often, selecting the affected files and doing a forced rescan with Shift + Ctrl + F5 > Force Update solves the problem - if it is solvable.
Unwritten metadata and the contents of AI trait tags is wiped by this procedure. If you have pending changes, you may want to write-back before using this command and copy AI tags into Attributes or XMP data.
Errors while writing files are usually caused by file system privilege problems (file not writable for IMatch), virus checkers blocking IMatch from writing the files or by damaged files. Check the message shown for the warning icon for more information.
After fixing the problem, let IMatch write-back the file again.
The files listed in this entry have no thumbnail or cache image. This is not necessarily an error, it just means that IMatch was unable to produce a thumbnail or other visual for the file. Many file formats managed by IMatch don't necessarily produce images.
You may want to check the files listed here occasionally, in case IMatch failed for some reason to produce a thumbnail for files where it usually does. Maybe the file was open in another application, or the virus checker blocked access to the file (at that time). Try to solve such issues by forcing a rescan of the affected files using Shift + Ctrl + F5 in the File Window.
You can exclude one or more file formats from being considered for this action. Click on the icon in the panel caption to open the settings for this panel. Enter a regular expression to ignore certain files. For example:
| Expression | Result |
|---|---|
| Ignore Corel Draw CDR files. |
| Ignore files with one of the extensions .crd, .ind or .gpx. |
The panel updates the Files without thumbnail count while you edit the regular expression.
If you enter an invalid regular expression, the icon is displayed.
Files with a pending write-back state are listed here for convenience. This entry mirrors the contents of the corresponding collection.
Lists files with unconfirmed faces. You should confirm faces because this improves face recognition results and performance.
Some of the entries explained here are only included when there are files with that particular problem.
This panel allows you to automatically check metadata in your files.
date created and date subject created?Checking such conditions and showing you the files which don't fulfill these conditions is the purpose of the Quality panel. It provides a set of standard tests which have proven useful in typical DAM scenarios. All you need to do is to enable the tests of interest to you.
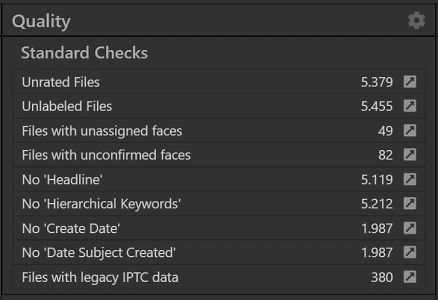
The Quality Panel with a number of typical checks enabled.
To configure the checks you want to include, click on the icon in the Quality panel header. This opens the configuration dialog box.
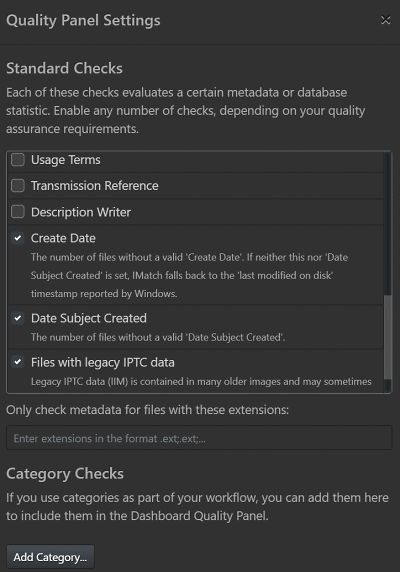
Enable the checks you want to automatically run when the Dashboard is active.
For very large databases or slower computers, enabling too many quality checks can result in longer execution times.
You can restrict metadata-based checks to specific file formats only with this option.
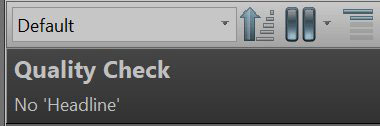
Click on the to view the files in a Result Window. The name of the quality check is used as the File Window caption:
Category checks allow you to verify if all files in the database are in a category or its child categories. IMatch counts the number of files in checked categories and displays it alongside the total number of files in your database.
Click on the category name to open the category and click on the button to open all files not included in the category in a result window.
You would apply this to categories to which all files must be assigned to pass the check. Consider a category hierarchy like:
|- Quality
  |- Excellent
  |- Good
  |- Usable
  |- Not that good, but I don't want to delete it
  |- Real Bad
Rule: All files in your database must be assigned to one child category of Quality, else the file is not 'finished'.
When you add a check for the Quality category to the Quality Panel, it will look similar to this:
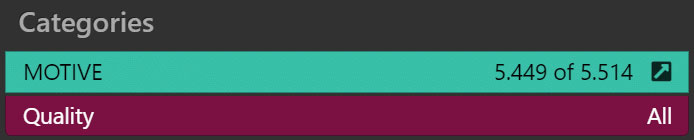
This example checks 2 categories:
MOTIVE category has only 5,499 out of a total of 5,514 files assigned (yes, small database).Quality category, or one of its children, which is perfect.IMatch displays categories using the color-coding as configured in the Category View.
Category checks always consider all files in the database and are not restricted by the file extensions applied to metadata checks.
This panel displays a huge list of important or interesting information about your database and the IMatch software.

What you can see in this panel:
If the Expert Mode is enabled, additional information about the state of IMatch and IMWS is included.
The Dashboard monitors the background processing queue in IMatch. When IMatch is scanning folders, adding/updating files, reading or writing metadata or running face recognition, the Dashboard displays progress information at the top:
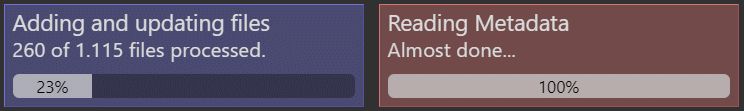
While the database is updated in the background, some panels pause. It makes no sense to constantly update the displayed information while data is changing 10 times a second due to the background processing. As soon as the background processing is complete, all Dashboard panels refresh automatically.
The Dashboard configuration is quite simple. You can control which panels to include, their widths and the order in which the panels appear.
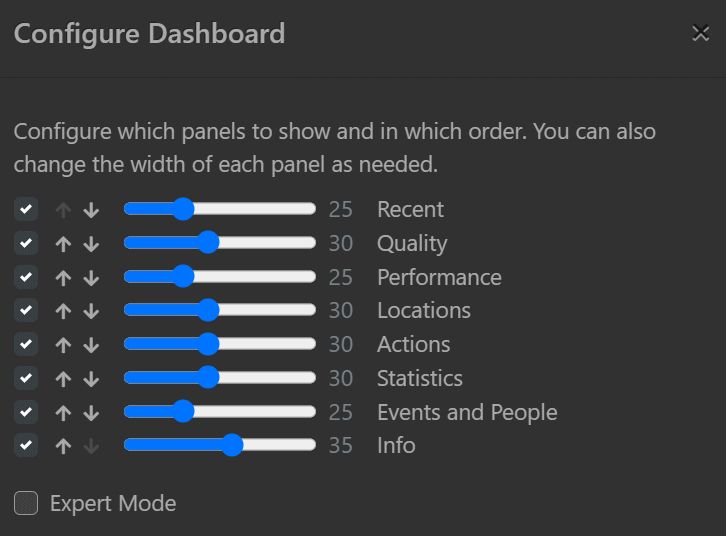
Arranging frequently used panels to the left avoids scrolling. And making panels wider or more narrow allows you to make the panels fit the information they display, to match your screen size and resolution.
When the Expert Mode is enabled, the Dashboard displays additional information in several panels. This information is mostly relevant for support personnel and developers.
In this mode you can also reset the settings of the Dashboard to default values.